What Percentage of Students Receive Financial Aid? Key Statistics and Facts [Updated June 2025]
Key findings:
- 83% of college students receive some form of financial aid.
- The average financial aid package is $16,360.
- Students from the lowest income bracket received an average of $14,240 in FAFSA aid.
- Pell Grants accounted for the largest share of federal aid, distributing $6.4 billion to students.
- $2 billion of federal student grant money is unclaimed.
- An increase in financial aid for undergraduate students is 39%.
How many students receive the President’s Education Award?
- Each year, up to 161 exceptional high school students are named U.S. Presidential Scholars, one of the nation's highest academic honors.
While this distinction highlights a small group of top-performing students, millions more rely on financial aid to make college a reality. Financial aid plays a crucial role in making higher education accessible and affordable for students across the United States. Understanding the scope and distribution of this aid is essential for students, families, and policymakers alike. This article explores key statistics and facts about the different types of financial assistance available, how many students receive aid, and the average amounts provided. By examining these data points, we can better grasp the current landscape of college funding and the impact of financial aid on students’ educational journeys.
Student access to financial aid
How many students receive financial aid? Access to financial aid is a critical factor that influences students’ ability to enroll and succeed in college. Understanding who receives aid and the extent of their access helps shed light on the effectiveness of federal and institutional support programs. This section examines key data on student participation in financial aid programs, providing insights into trends and disparities in access.
Understanding how many students get aid is crucial to assessing the affordability and accessibility of higher education.
What percentage of college students receive financial aid?
Over the past two decades, the number of students who received financial aid has increased steadily across all types of institutions. Public four-year colleges and private colleges have consistently shown higher levels of aid coverage compared to two-year public colleges. The following chart highlights the long-term trends in receiving financial aid by institution type.
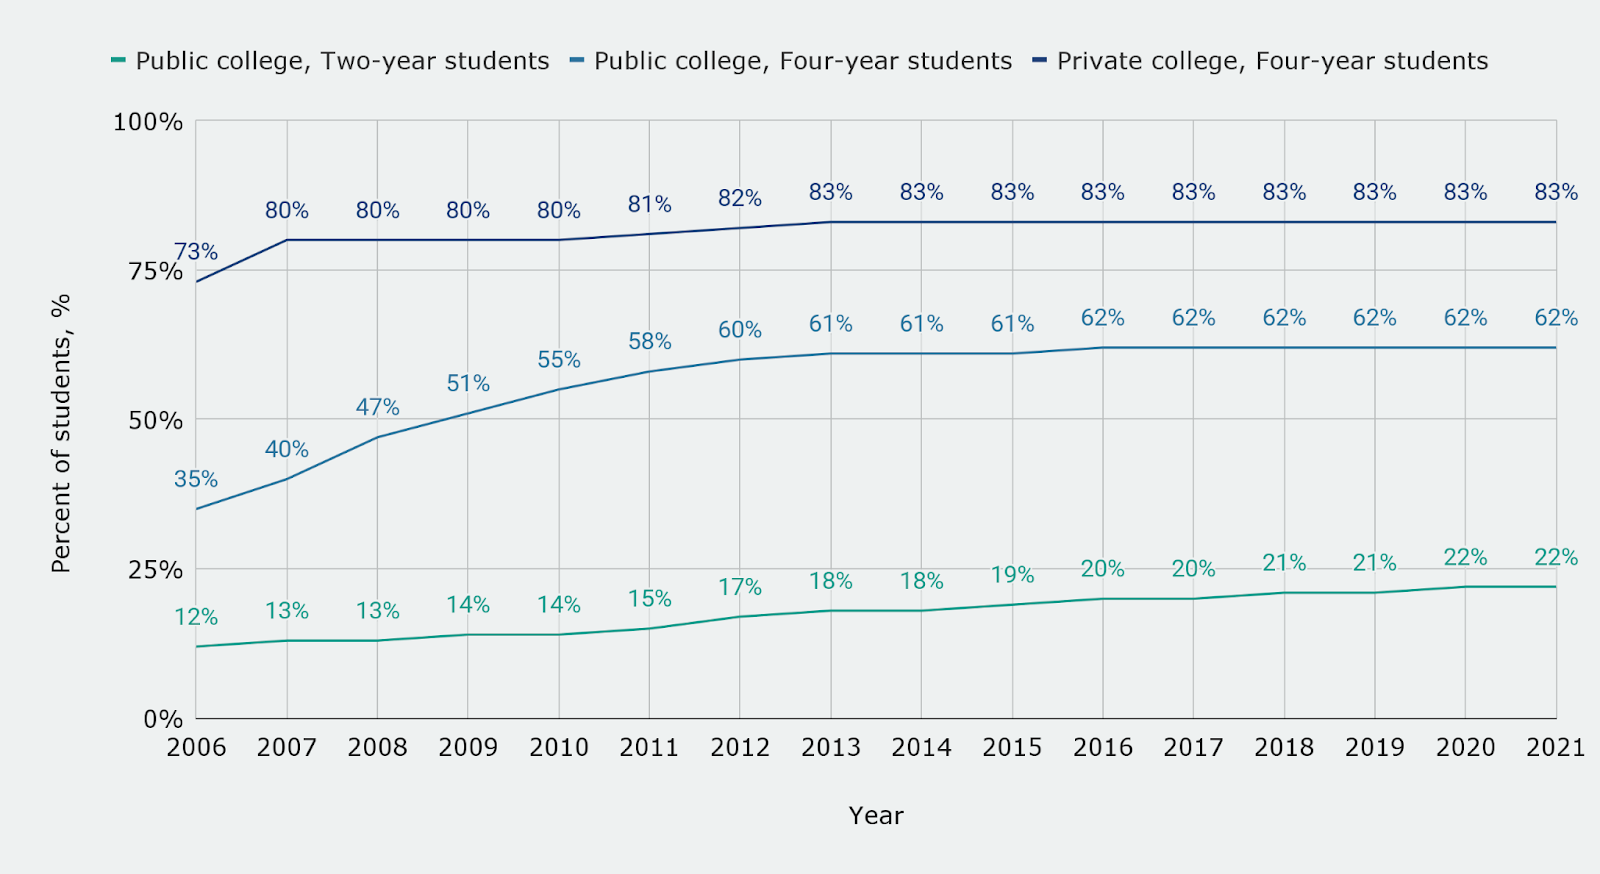
How many students receive financial aid?
- 83% of college students received some form of financial aid in 2021.
Percentage of students who received financial aid
| Year | Public college, Two-year students | Public college, Four-year students | Private college, Four-year students |
| 2006 | 12% | 35% | 73% |
| 2007 | 13% | 40% | 80% |
| 2008 | 13% | 47% | 80% |
| 2009 | 14% | 51% | 80% |
| 2010 | 14% | 55% | 80% |
| 2011 | 15% | 58% | 81% |
| 2012 | 17% | 60% | 82% |
| 2013 | 18% | 61% | 83% |
| 2014 | 18% | 61% | 83% |
| 2015 | 19% | 61% | 83% |
| 2016 | 20% | 62% | 83% |
| 2017 | 20% | 62% | 83% |
| 2018 | 21% | 62% | 83% |
| 2019 | 21% | 62% | 83% |
| 2020 | 22% | 62% | 83% |
| 2021 | 22% | 62% | 83% |
The data underscores a significant reliance on financial aid among college students in the United States. While private four-year institutions have maintained high aid coverage (over 80%) for more than a decade, public four-year colleges have shown a gradual increase from 35% in 2006 to 62% in 2021. Two-year public colleges, though lower in percentage, have also experienced growth, nearly doubling over the same period. This trend reveals how the percentage of students on financial aid has become a critical measure of educational equity and the growing financial burden of college.
Moreover, the data shows that almost all students whose parents’ income is less than $40,000 receive financial aid.
Financial aid access by parental income bracket
These data highlight a strong correlation between family income and the likelihood of receiving grant aid.

- The percentage of students receiving financial aid is highest among those from families earning less than $40K, an overwhelming 99%.
- Students from high-income households ($160K or more) still receive grant aid at a notable rate of 86%, reflecting the role of merit-based awards.
- Only 66% of independent students receive grant aid, the lowest among all groups, pointing to potential gaps in eligibility or outreach.
Percentage of grant recipients by income group
| Parents’ income | Share receiving grant aid |
| Less than $40K | 99% |
| $40K to $79.9K | 96% |
| $80K to $119.9K | 84% |
| $120K to $159.9K | 81% |
| $160K or Higher | 86% |
| Independent | 66% |
Students from lower-income families receive grant support at overwhelmingly high rates, 99% of those with parental income under $40K and 96% in the $40K-$79.9K range. While access remains relatively high even in the $80K-$159.9K range (above 80%), it slightly declines as income increases. Interestingly, students with parental income over $160K still report an 86% grant receipt rate, likely due to institutional or merit-based awards. Meanwhile, independent students, often older or financially self-sufficient, receive the least support, with only 66% receiving grants. These patterns suggest that while need-based aid is concentrated among lower-income groups, grant aid continues to reach a broad cross-section of the student population.
After exploring overall student access to aid, it’s essential to examine how federal support is distributed across different financial assistance programs.
How many students receive federal financial aid?
How many students receive Pell grants? How many students benefit from other programs? The chart below breaks down the number of recipients and the average amount awarded per student across major federal aid programs, offering valuable financial aid statistics at a glance.

- The average Pell Grant amount of $4,930 supported 6.4 million students.
- 10 million students benefited from Education Tax Benefits, although the average aid per recipient was only $1,390.
- The GI Bill provided the highest average support, with $16,300 per recipient, but only 0.6 million recipients received it.
Number of students benefiting from federal financial aid
| Program | Recipients, million persons | Average aid per recipient, $ |
| Pell Grant | 6.4 | $4,930 |
| Direct Subsidized Loans | 4.1 | $3,780 |
| Direct Unsubsidized Loans | 5.6 | $7,850 |
| FSEOG | 1.8 | $800 |
| Federal Work-Study | 0.4 | $1,980 |
| GI Bill Benefits | 0.6 | $16,300 |
| Education Tax Benefits | 10.0 | $1,390 |
How many students receive federal financial aid?
- At least 10 million students receive federal financial aid.
These financial aid statistics show a wide variation in both reach and generosity across federal programs. While the Pell Grant and federal loans serve millions of students, high-value programs like the GI Bill and Work-Study reach fewer individuals.
How many students receive Pell grants?
- 6.4 million students received Pell grants.
What is the average Pell grant per year?
- The average Pell Grant amount is $4,930 per year.
Overall, federal aid plays a crucial role in reducing the financial burden for millions of college students, though the type and amount of assistance vary significantly.
Beyond the types of aid students receive, it’s also important to examine how many actually apply for it through the FAFSA process.
FAFSA participation statistics
The following data offers a snapshot of FAFSA statistics, showing national FAFSA completion rates from 2017 to 2024.
/Year")
- FAFSA completion peaked at 52% between 2017 and 2019 but declined to 43% by 2024.
- The most significant drop occurred between 2023 and 2024, falling by 8 percentage points.
- Since 2021, completion rates have remained below 51%, signaling a concerning downward trend in access.
Trends in FAFSA submission for federal aid
| Year | Completion rate, % |
| 2017 | 52% |
| 2018 | 52% |
| 2019 | 52% |
| 2020 | 50% |
| 2021 | 47% |
| 2022 | 50% |
| 2023 | 51% |
| 2024 | 43% |
These FAFSA statistics reveal a notable decline in student participation over recent years, which could affect eligibility for billions in federal aid. As average FAFSA aid per semester and average FAFSA aid by income often determine how students fund their education, a drop in completions limits access to critical support.
While national trends provide a broad view, FAFSA participation rates vary significantly depending on school demographics and location.
FAFSA completion by different groups of recipients
This breakdown of FAFSA statistics highlights disparities in completion rates based on income level, minority representation, and school locale.
- FAFSA completion was higher in higher-income schools (49%) compared to low-income schools (44%).
- Schools with a low minority share had a 4-point higher completion rate (48%) than those with a high minority share (44%).
- Students in towns had the lowest completion rate at 41%, compared to 46% in cities and 45% in rural and suburban areas.
FAFSA completion rates across different student groups
| Group | Completion rate, % |
| Higher-income schools | 49% |
| Low-income schools | 44% |
| High minority share schools | 44% |
| Low minority share schools | 48% |
| City | 46% |
| Rural | 45% |
| Suburban | 45% |
| Town | 41% |
The FAFSA statistics underscore persistent equity gaps in access to federal financial aid. Students in low-income and high-minority schools are completing FAFSA forms at lower rates, which may limit their access to average FAFSA aid opportunities. Geographic disparities, such as lower rates in towns, further complicate efforts to reach underserved groups.
Types and amounts of financial aid
Financial aid comes in various forms, each designed to help students manage the cost of higher education in different ways. Understanding the types and amounts of aid available, such as grants, loans, scholarships, and work-study programs, is essential for grasping how students finance their college experience. This section breaks down the key categories of financial assistance and highlights typical award amounts to provide a comprehensive overview.
To better understand how students fund their education, it’s crucial to look at the composition and size of typical financial aid packages.
Average financial aid packages
The college financial aid statistics below compare the average financial aid package for undergraduate and graduate students, breaking it down into grants, federal loans, and other sources. These numbers help illustrate the average financial aid amount students receive and provide insight into the balance between average FAFSA aid, average scholarship amount, and borrowing. Understanding the average financial aid for college is essential when evaluating affordability and support at different education levels.

- The average financial aid per student is $13,360 for undergraduates and $28,420 for graduates.
- 87% of first-year undergraduate students received an average financial aid package of $16,360, including $11,610 in grants and $3,900 in federal loans.
- Graduate students received significantly more total aid $28,420 on average, largely due to $17,240 in federal loans.
- Grants made up 71% of undergraduate aid but only 38% of graduate aid, indicating heavier reliance on loans in graduate programs.
Overview of standard financial aid packages
| Type | Grants | Federal loans | Other aid | Total aid |
| Undergraduate | $11,610 | $3,900 | $850 | $16,360 |
| Graduate | $10,750 | $17,240 | $430 | $28,420 |
- The average financial aid amount for undergraduate students is $16,360, and for graduate students is $28,420.
These college financial aid facts reflect meaningful differences in the average financial aid for college across education levels. While undergraduates rely more heavily on grants and average scholarship money, graduate students are far more dependent on loans, increasing their long-term financial burden. The modest portion of aid from “other” sources, just $430 to $850, shows limited supplementary support beyond primary aid channels. As policymakers consider adjustments to the average Pell grant amount, average FAFSA aid, and average scholarship amount per student, addressing these structural imbalances will be key to making higher education more equitable and sustainable.
While total aid amounts are informative, breaking them down by income level reveals how financial need shapes actual support received through FAFSA.
Average FAFSA aid by income level
This chart presents average FAFSA aid by income, comparing students from the lowest and highest income brackets across public and private institutions. These FAFSA statistics highlight disparities in awarded amounts based on financial need and offer deeper insight into overall financial aid statistics for different school types.

Average FASFA aid by income:
- For students with the lowest income, average FAFSA aid per year is $11,280 for public institutions and $18,120 for private institutions.
- For students with the highest income, average FAFSA aid per year is $3,620 for public institutions and $14,800 for private institutions.
FAFSA aid distribution across income groups
| Institution Type | Lowest income, $ | Highest income, $ |
| Public | $11 280 | $3 620 |
| Private | $18 120 | $14 800 |
These financial aid statistics demonstrate that FAFSA is most impactful for students with the greatest financial need, especially at private institutions. The pronounced differences in average FAFSA aid per year by income underscore the role of federal aid in addressing educational inequality. However, the fact that higher-income students still receive substantial aid, particularly at private schools, raises questions about aid targeting and institutional pricing strategies. These FAFSA statistics suggest that while need-based aid is significant, optimizing its distribution remains a crucial challenge for ensuring equitable access.
In addition to federal aid, many students rely on scholarships and grants to reduce out-of-pocket college expenses.
What percentage of students receive scholarships or grants?
The chart below shows what percentage of students receive scholarships or grants for college across different institution types and over time. These data help answer how many students receive scholarships, and reveal evolving trends in financial aid accessibility, especially among students at public vs. private colleges. Understanding what percentage of students get scholarships is critical for evaluating how well aid systems meet students’ financial needs.
, Public 4-Year (%) і Private 4-Year (%)")
What percentage of students get scholarships?
- In 2021-22, 83% of students at private 4-year colleges received scholarships or grants, compared to 60% at public 4-year institutions.
- The percentage of public 2-year college students receiving scholarships rose from 12% in 2006-07 to 22% in 2021-22.
- Between 2006-07 and 2021-22, public 4-year institutions saw the largest increase by 25% in student grant/scholarship recipients.
How many students receive scholarships?
- In 2021-22, 13 million students at private 4-year colleges received scholarships or grants, compared to 9 million in public 4-year institutions.
- In 2021-22, 0.7 million graduate students received scholarships.
Proportion of students awarded scholarships or grants
| Year | Public 2-Year | Public 4-Year | Private 4-Year |
| 2006-07 | 12% | 35% | 73% |
| 2010-11 | 13% | 40% | 80% |
| 2015-16 | 20% | 47% | 80% |
| 2021-22 | 22% | 60% | 83% |
What is the average scholarship amount per student?
- The average scholarship per year varies from $100–$2,000 (for small scholarships) to $2,000–$20,000 (for larger scholarships) based on your financial situation and how aggressively you apply for scholarships.
These figures provide valuable insight into what percentage of students receive scholarships or grants for college, showing steady increases across all institution types over the past 15 years. While private 4-year colleges have consistently supported a high share of students with scholarships (over 80%), public institutions have shown substantial progress in expanding access. Still, the gap between sectors remains noticeable. Knowing what percentage of students get scholarships and how many students receive scholarships helps policymakers and families gauge how equitably non-loan financial aid is distributed across higher education.
Despite the extensive federal and institutional efforts to provide financial aid, significant missed opportunities and gaps persist in the system.
Missed opportunities and gaps in financial aid
Many eligible students fail to apply for aid or receive insufficient support, which can hinder their ability to enroll, persist, and graduate. Addressing these gaps is critical to ensuring equitable access to higher education and closing the affordability divide for underserved populations. Understanding where and why these opportunities are missed is essential for developing targeted policies that improve financial aid outreach and effectiveness.
So, how much money from federal grants remains unclaimed?
- $2 billion of federal student grant money is unclaimed.
To better understand the distribution of federal financial aid, it is important to examine how much funding each major program provides annually. This breakdown reveals the scale and scope of support available to students through various federal aid channels.
How much money do different programs provide?
This chart summarizes the total federal aid distributed by major financial assistance programs. These FAFSA statistics show how much money each program contributes annually, giving a clearer picture of the relative size and role of different funding sources within the U.S. financial aid system.

- Pell Grants accounted for the largest share of federal aid, distributing $6.4 billion to students.
- Direct Subsidized Loans followed with $4.4 billion in total funding.
- Grad PLUS and Parent PLUS loans combined provided $1.1 billion, the smallest among the listed programs.
Comparative federal aid program funding
| Federal program | Federal aid, million $ |
| Pell Grants | $6.4 |
| Direct Subsidized Loans | $4.4 |
| Direct Unsubsidized Loans | $3.9 |
| Grad PLUS + Parent PLUS | $1.1 |
These FAFSA statistics highlight the central role of Pell Grants and Direct Loans in the federal financial aid landscape. Grants remain the primary source of non-repayable support, while loan programs provide a significant, though more burdensome, means of covering educational costs. The relatively smaller share allocated through PLUS loans reflects their more selective use, particularly among graduate students and parents.
To grasp the overall scale of federal student support, it is essential to examine the total funding distributed annually through FAFSA.
How much money does FAFSA give each year?
The data below illustrates how much money FAFSA gives each year across major federal aid categories, highlighting the significant role FAFSA plays in directing billions of dollars in student support. These figures form a core part of broader FAFSA statistics related to student financing.
/Type of Federal Aid via FAFSA")
- Total federal aid distributed via FAFSA reached $130 billion annually.
- Federal loans represent the largest portion, totaling approximately $78.4 billion.
- Pell Grants provide nearly $50 billion in direct grant aid, while campus-based programs contribute $1.6 billion.
Annual federal aid distributed via FAFSA
| Type of federal aid | Amount, billion $ |
| Total Federal Aid via FAFSA | $130.0 |
| Federal Loans (Total est.) | $78.4 |
| Pell Grants | $49.9 |
| Campus-Based Aid (FSEOG, WS) | $1.6 |
These FAFSA statistics underscore the massive scale at which FAFSA facilitates access to federal financial aid each year. While loans constitute the majority of funding, Pell Grants remain a vital source of non-repayable support for millions of students. Campus-based aid programs, although smaller in total funding, play a targeted role in supporting those with the greatest need. Understanding how much money FAFSA gives each year is crucial for evaluating the impact of federal aid on college affordability nationwide.
Financial aid trends
Analyzing financial aid trends over time reveals how policies and economic factors shape the support available to college students. Tracking changes in the amount, types, and distribution of aid helps identify emerging challenges and opportunities in higher education funding. This section presents key trends in financial aid, highlighting shifts that impact student access and affordability.
Graduate education often requires a distinct financial aid approach due to higher tuition and living expenses.
Total aid for graduate students
The chart below tracks the total federal aid allocated to graduate students over the past two decades, offering key insights into trends in graduate student financial aid. These financial aid statistics reveal how funding levels have evolved, reflecting shifts in policy and demand for graduate education support.
/Year")
- Total federal aid for graduate students nearly doubled from $39.4 billion in 2003-04 to $72.3 billion in 2010-11.
- Aid levels remained relatively stable around $72 billion through 2021-22 before declining slightly to $66.6 billion in 2023-24.
- Total financial aid for graduate students in 2023-24 is $66.6 billion.
Aggregate graduate student aid levels
| Year | Total graduate aid, billion $ |
| 2003-04 | $39.4 |
| 2010-11 | $72.3 |
| 2021-22 | $72.2 |
| 2022-23 | $66.8 |
| 2023-24 | $66.6 |
These financial aid statistics highlight the significant growth in graduate student financial aid during the early 2000s, followed by a plateau and recent slight decline. The sustained high funding levels underscore the importance of federal support in enabling advanced degrees. Monitoring these trends is critical for understanding how accessible graduate education remains and how federal policies impact graduate students’ financial realities.
Examining federal funding for undergraduates provides critical insights into the accessibility and affordability of higher education for the majority of students.
Financial aid for undergraduate students
The chart below illustrates the growth in financial aid awarded to undergraduate students over the last two decades. These undergraduate financial aid trends reflect changing federal priorities and student needs, forming an important part of overall financial aid statistics.
/Year")
- An increase in financial aid for undergraduate students is 39%.
- Total undergraduate aid increased from $137.1 billion in 2003-04 to a peak of $228.7 billion in 2013-14.
- Since 2013-14, aid levels have declined to $190.1 billion by 2023-24.
- Despite the recent decrease, total undergraduate aid remains significantly higher than two decades ago.
Trends in financial aid for undergraduate students
| Year | Total undergraduate aid, billion $ |
| 2003-04 | $137.1 |
| 2013-14 | $228.7 |
| 2023-24 | $190.1 |
These undergraduate financial aid trends highlight a strong growth in financial aid during the early 2000s, which helped expand access to college. However, the subsequent decline since 2013-14 raises concerns about the sustainability of funding levels. The recent reduction in aid may impact college affordability for many students, underscoring the need for continued monitoring of financial aid statistics to guide policy and support decisions.
Beyond federal aid, private institutions also play a key role in reducing the cost of attendance through institutional grants and tuition discounts.
Tuition discount rates at private colleges
One of the most significant yet often overlooked forms of financial assistance comes in the form of tuition discounts offered by private colleges. These discounts, typically awarded as institutional grants or merit-based aid, reduce the actual price students and families pay, often by a substantial margin. Examining tuition discount rates provides valuable insight into how private colleges balance affordability, enrollment goals, and financial sustainability.

- The average tuition discount rate at private colleges in 2023-24 is 56%.
Rising tuition discount rates at U.S. private colleges
| Year | Discount, % |
| 2014-15 | 47.1% |
| 2015-16 | 48.0% |
| 2016-17 | 48.2% |
| 2017-18 | 50.5% |
| 2018-19 | 51.2% |
| 2019-20 | 51.2% |
| 2020-21 | 52.4% |
| 2021-22 | 53.8% |
| 2022-23 | 54.8% |
| 2023-24 | 56.1% |
These data show a steady upward trend in tuition discount rates at private colleges over the past decade. From 47.1% in 2014-15 to a record-high 56.1% in 2023-24, the average discount has increased by nearly 9 percentage points. This rise reflects growing institutional efforts to attract and retain students amid increasing sticker prices and concerns about affordability. While higher discounts can ease the financial burden for many families, they also raise questions about the sustainability of college revenue models and the transparency of pricing practices in private higher education.
Conclusions
- Financial aid is both a gateway and a barrier. While a vast majority of students receive some form of assistance, deep inequalities persist in how aid is accessed, applied for, and distributed. High-income students still receive substantial support, while lower FAFSA completion rates among underserved groups reveal persistent structural gaps.
- Billions in aid remain untapped. The $2 billion in unclaimed federal grant money highlights a crucial breakdown between eligibility and access. Addressing barriers to FAFSA completion, whether informational, logistical, or psychological, should be a national priority.
- Grants matter, but loans dominate. Graduate students are increasingly reliant on federal loans, and the growing loan share in aid packages signals long-term debt burdens, especially for those pursuing advanced degrees without robust institutional aid.
- Private colleges mask true costs through steep tuition discounts. While these discounts provide relief to students, they raise questions about price transparency and institutional sustainability. What you see on the price tag is rarely what you pay.
- Averages don’t tell the whole story. From parental income brackets to school location and institutional type, financial aid distribution is highly uneven. Students and families should look beyond the national numbers and evaluate aid opportunities based on personal, regional, and demographic context.
Sources
- Ma, Jennifer, Matea Pender, and Meghan Oster (2024). Trends in College Pricing and Student Aid 2024, New York: College Board, https://research.collegeboard.org/media/pdf/Trends-in-College-Pricing-and-Student-Aid-2024-ADA.pdf. Accessed 03 July 2025.
- Annual NACUBO Tuition Discounting Study Finds Financial Aid Awards and Undergraduate Enrollment on the Rise at Private Colleges and Universities. https://www.nacubo.org/Press-Releases/2024/Annual-NACUBO-Tuition-Discounting-Study-Finds-Financial-Aid-Awards-on-the-Rise. Accessed 03 July 2025.
- Hanson, Melanie. “Financial Aid Statistics [2025]: Average Aid per Student.” Education Data Initiative, https://educationdata.org/financial-aid-statistics. Accessed 03 July 2025.
- “About the Program.” U.S. Department of Education, http://www.ed.gov/grants-and-programs/recognition-programs/us-presidential-scholars-program/us-presidential-scholars-program-fact-sheet. Accessed 03 July 2025.
- Jimenez-Ekman, Gabriel. “What’s the Average Amount of Scholarships That Students Win? – Scholarships360.” Scholarships360, https://scholarships360.org/scholarships/whats-the-average-amount-of-scholarships-that-students-win/. Accessed 03 July 2025.